
预测路由队列详细信息视图
单个队列的队列详细信息视图显示所选队列性能的不同方面。 该页面包含以下选项卡:
- 概述 – 打开队列详细信息视图,总结预测路由对选定时间段的影响。 有关概述选项卡的更多信息可在本页的后续部分中找到。
- 预测模型-显示有助于所选队列的路由决策的主要功能。 有关更多信息,请参阅查看影响预测性路由决策的功能。
队列详细信息看法包含有关选定时间段内预测路由影响的指标。
在工作区中设置默认时区
在查看任何分析视图之前,您可以在分析工作区中设置默认时区。
要在工作区中设置默认时区,请执行以下步骤:
- 单击 “ 性能” > “工作区”。
- 点击菜单 > 分析>分析工作区。
- 在左侧,从时区下拉菜单中,选择所需的时区作为分析工作区的默认时区。
查看有关特定队列的详细信息看法,去表现>工作区>联络中心>预测路线,然后从列表中单击特定队列的名称。
查看特定队列的详细信息视图,执行以下操作:
- 点击菜单 > 分析>分析工作区。
- 在默认部分,搜索预测路由然后单击视图名称将其打开。
- 单击特定队列的名称。
有关详细信息,请参阅For more information, see预测路由队列影响视图。
特定队列的详细信息取决于您选择的 KPI。
使用平均处理时间 KPI 显示以下详细信息。
| 明细 | 描述 | 笔记 (供参考,请参阅图片) |
|---|---|---|
|
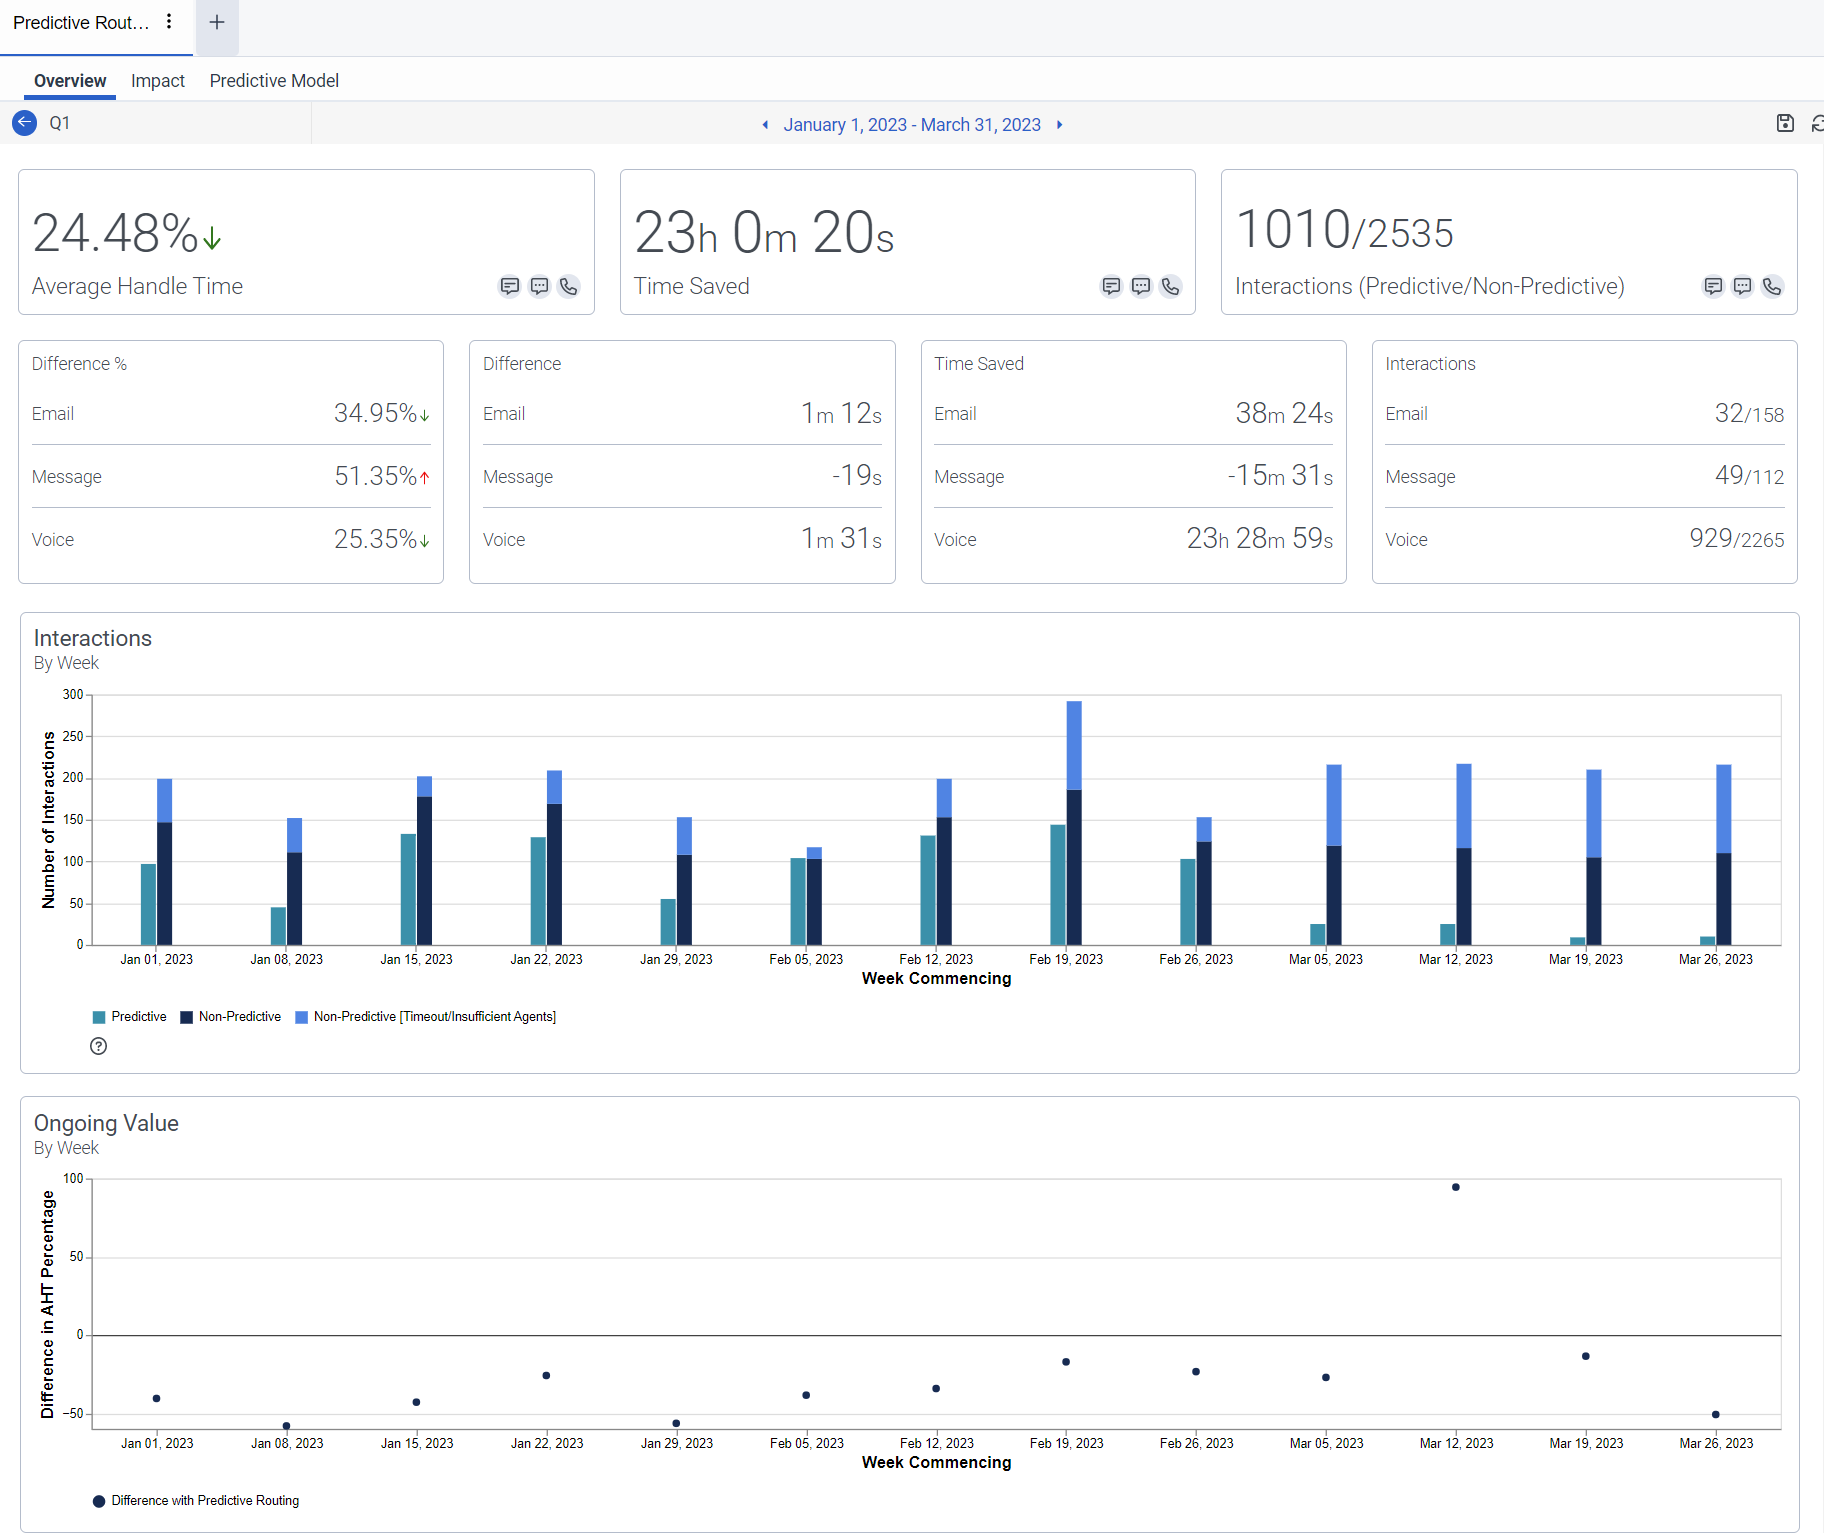
平均处理时间(AHT 差异百分比) |
表示在选定时间段内,使用预测路由方法路由的交互的处理时间量与使用非预测路由方法路由的交互的处理时间量的百分比差异。 |
当队列支持多种媒体类型时,除了 AHT 差异 % 值之外,还会出现每种媒体类型的 AHT 差异 % 的细目分类。 AHT 差异百分比与每种媒体类型百分比的总和或平均值不匹配。 |
| AHT 的区别 |
表示交互之间的 AHT 值的差异那使用预测路由和交互进行路由那在每次交互选定的日期范围内,无需预测路由即可进行路由。该值以小时、分钟和秒为单位。 |
AHT 差异值仅针对特定(单个)媒体类型队列显示。 如果队列包含多种媒体类型,则会显示每种媒体类型的 AHT 差异的细目分类。 |
| 节省了时间 |
表示在所选时间段内使用预测性路径时节省的处理时间。 节省的时间是通过将使用预测路由的总交互次数乘以指定日期范围内的 AHT 差异来计算的。 |
当队列支持多种媒体类型时,按媒体类型细分的数据也会出现在“节省时间”表下方。 |
| 交互 |
表示互动总数那采用预测路由进行路由,与其他路由方法处理的数量相比。 例如,在下面的单媒体队列图像中,1010 是交互总数路由使用预测路由时处理的交互总数为 2535,不使用预测路由时处理的交互总数为 2535。 |
当队列支持多种媒体类型时,还会出现根据媒体类型细分的数据。 如果任何媒体类型的互动次数为零,则互动总数会有所不同,因为总互动次数不考虑零值。 |
| 互动条形图 |
以周为间隔显示选定日期范围内的预测路线和非预测路线量。 如果 Genesys Cloud 在预测路由超时之前未找到符合条件的座席,或者队列中的座席数量为三个或更少,则交互将通过标准路由,这是后备路由方法。有关代理选择流程的更多信息,请参阅代理商选择流程。 |
图表中显示的第一周从所选日期范围的第一天开始。 最后一周是完整或部分的一周,具体取决于所选的日期范围。 非预测(超时/代理不足)栏表示 Genesys Cloud 尝试预测路由但使用非预测路由方法的所有交互。 |
| 持续值(AHT 差异百分比散点图) |
此散点图描绘了每周高于或低于零线的 AHT 差异百分比值。 零线上的圆点表示预测性路由与非预测交互作用的 AHT 没有区别。 零线以上的正值表示使用预测路由的交互平均比不使用预测路由的交互具有更长的处理时间。 低于零线的值表示使用预测路由选择传送的交互比不使用预测路径传送的交往具有更短的处理时间。 要查看该特定日期的数据,请将鼠标悬停在图表上其中一个点的上方。 |
图表中显示的第一周从所选日期范围的第一天开始。 最后一周是完整或部分的一周,具体取决于所选的日期范围。 |
使用下次联系避免 KPI 显示以下详细信息。
| 明细 | 描述 | 笔记 (供参考,请参阅图片) |
|---|---|---|
|
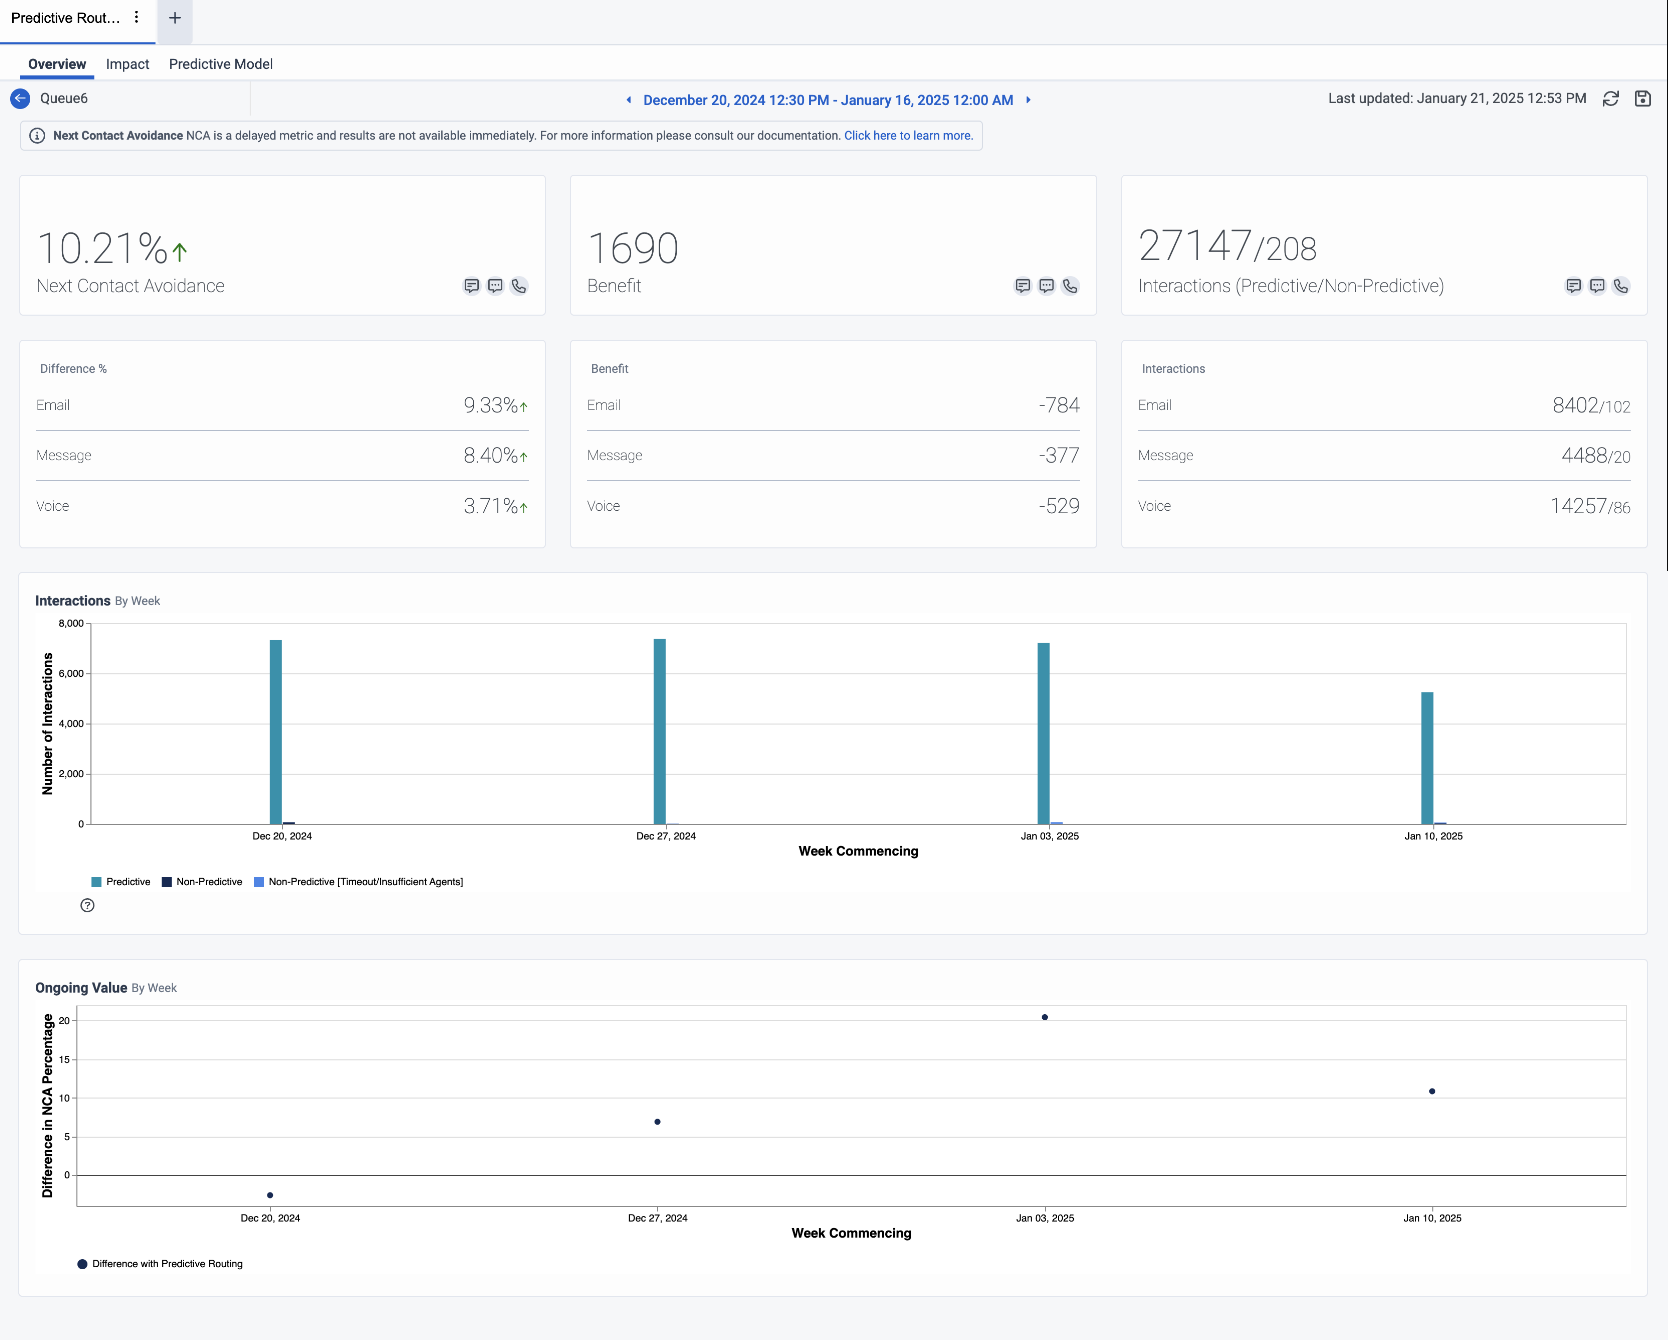
避免下次接触(NCA 差异 %) |
表示在选定时间段内,使用预测路由方法路由的避免重复联系的交互次数与使用非预测路由方法路由的避免重复联系的交互次数之间的百分比差异。 |
当队列支持多种媒体类型时,除了 NCA 差异 % 值之外,还会出现每种媒体类型的 NCA 差异 % 的细目分类。 NCA 差异 % 与每种媒体类型的 % 的总和或平均值不匹配。 |
| 益处 |
表示在选定时间段内使用预测路由时重复避免接触的交互次数。 该收益是根据避免的重复接触次数来计算的。 |
当队列支持多种媒体类型时,效益表下方也会显示按媒体类型细分的数据。 |
| 交互 |
表示使用预测路由处理的交互总数与其他路由方法处理的交互总数的比较。 例如,在下面的单媒体队列图像中,27147 是使用预测路由处理的交互总数,208 是未使用预测路由处理的交互总数。 |
当队列支持多种媒体类型时,还会出现根据媒体类型细分的数据。 如果任何媒体类型的互动次数为零,则互动总数会有所不同,因为 Genesys Cloud 不会将零值视为总数。 |
| 互动条形图 |
以周为间隔显示选定日期范围内的预测路线和非预测路线量。如果 Genesys Cloud 在预测路由超时之前未找到符合条件的座席,或者队列中的座席数量为三个或更少,则交互将通过标准路由,这是后备路由方法。有关代理选择流程的更多信息,请参阅代理商选择流程。 |
图表中显示的第一周从所选日期范围的第一天开始。 最后一周是完整或部分的一周,具体取决于所选的日期范围。 非预测(超时/代理不足)栏表示 Genesys Cloud 尝试预测路由但使用非预测路由方法的所有交互。 |
| 持续值(NCA 差异 % 散点图) |
该散点图描绘了零线上方或下方的每周 NCA 差异 % 值。 零线上的点表示与非预测交互相比,预测路由对预测交互的 NCA 没有影响。 零线以上的正值表示预测路由性能有所改善。 零线以下的负值表示预测路由没有比其他路由方法提供更好的结果。 要查看该特定日期的数据,请将鼠标悬停在图表上其中一个点的上方。 |
图表中显示的第一周从所选日期范围的第一天开始。 最后一周是完整或部分的一周,具体取决于所选的日期范围。 |
- 要更改时间段,请单击顶部的日期看法并选择不同的日期。
- 要返回预测路由列表,请点击队列旁边的返回图标看法姓名
 。
。