Charts in Journey Management

必备 
  • Genesys Cloud CX 1、Genesys Cloud CX 2、Genesys Cloud CX 2 Digital、Genesys Cloud CX 3 或 Genesys Cloud CX 3 Digital 许可证
  • 旅程管理附加功能
  • 旅程管理创造者,编辑或者查看器角色

    图表使用旅程管理提供数据趋势分析、帮助排除故障并提供有关运营和客户行为的见解。 您可以构建图表来调查、评估和审查旅程指标。借助图表,您可以分析一段时间内的趋势,比较数据点,跟踪进度或变化并了解您的客户。

    You can create charts with data from your previously constructed journey.

    Journey and charts

    Charts help contact center managers, journey managers, customer experience managers, and analysts to:

    • understand the customer journey over a period
    • understand relationships or correlations between different event cards
    • understand the impact on the holistic customer journey in the contact center
    • optimize performance of the journey, when there was a change in performance

      Filters in charts

      Charts only retrieve the data of the journey value. If you choose to exclude certain attribute values, then the chart does not include them. Alternatively, if you choose to include only certain attribute values, then only the included values are present in the chart breakdown.

      Genesys Cloud applies the same filters for the charts that you applied for the journey.

      注释:
      • You can create up to 10 charts per journey.
      • If you duplicate a journey, Genesys Cloud also duplicates the journey’s chart configurations.

      Create a chart for a journey

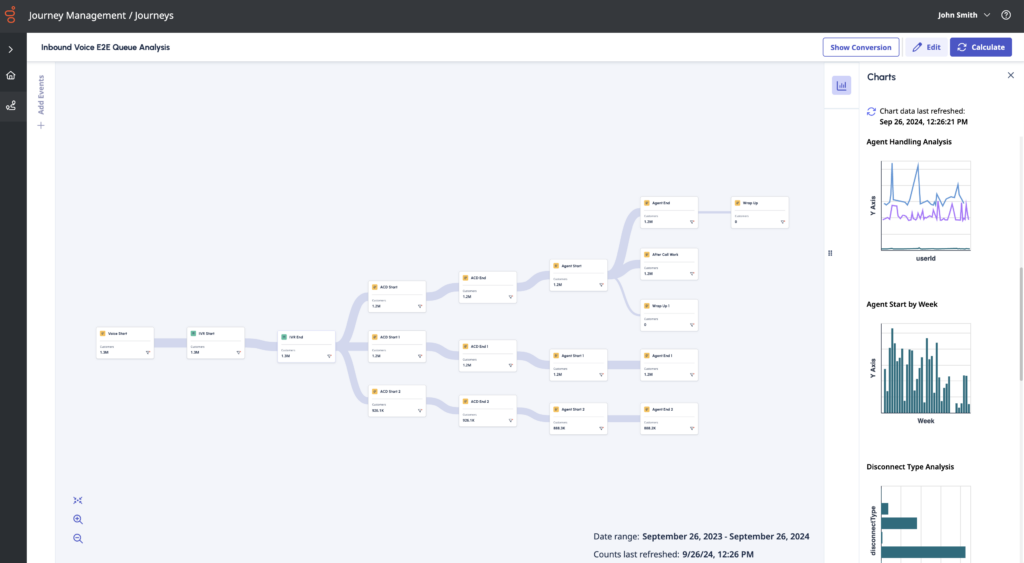
      On the right side of the journey canvas, you can view the charts you create. Calculated charts display a visual thumbnail; charts that still need calculation display the Requires calculation message.

      To access chart configuration, click the Charts icon in the upper right corner of the screen. Click a chart to see a detailed visual representation.

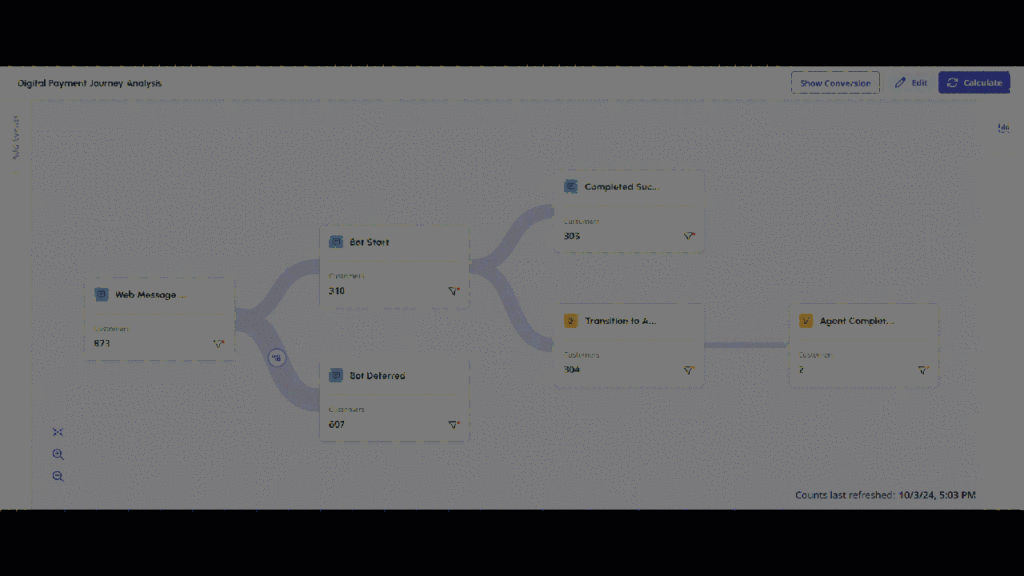
      Click the video to see the process. Open Charts

      Create a new chart

      Click New chart. Genesys Cloud navigates you to the chart configuration screen. Your journey must be in Edit mode for you to edit the charts as well.

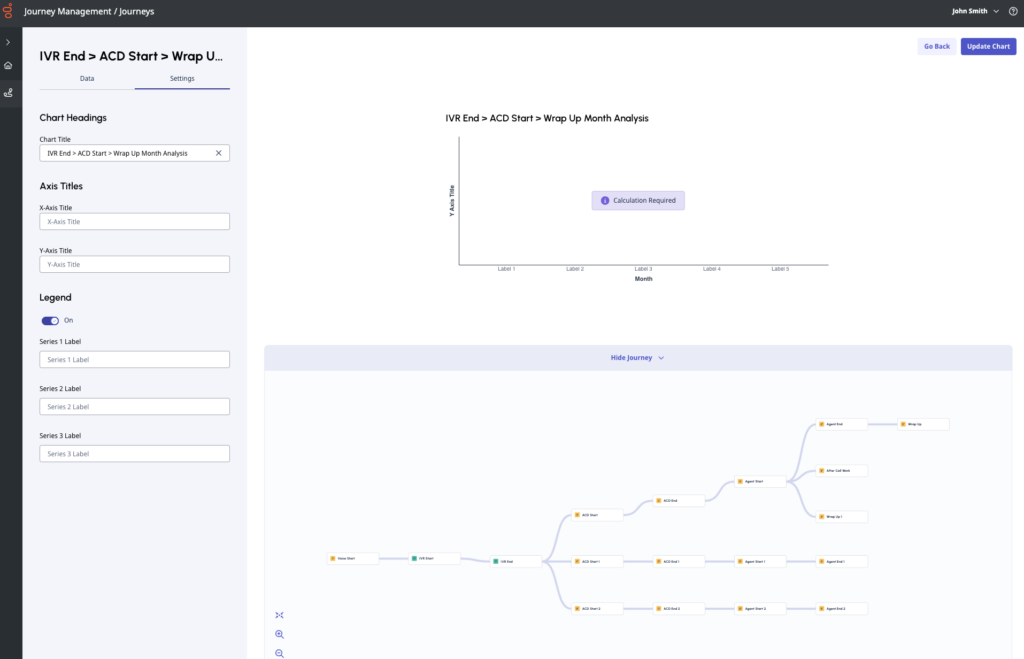
      Chart configuration screen

      On the left side of the chart configuration screen, you can edit your chart; the right side shows the visual representation of the chart and your journey for reference. If you don’t want to see the journey, click Hide journey.

      注释:

      • Charts are enabled once you have at least one event in the journey. You can add charts as you add and connect events, or you can create the journey of interest first, and then decide how to use charts to support that analysis.
      • The Edit, Save, and Calculate functions govern both the journey canvas and the chart editor. You cannot perform a calculation on a chart without performing a calculation on the entire journey. Therefore, Genesys Cloud recommends that you create the journey, save it, and then create a couple of corresponding charts before you perform a calculation.

      “设置”选项卡

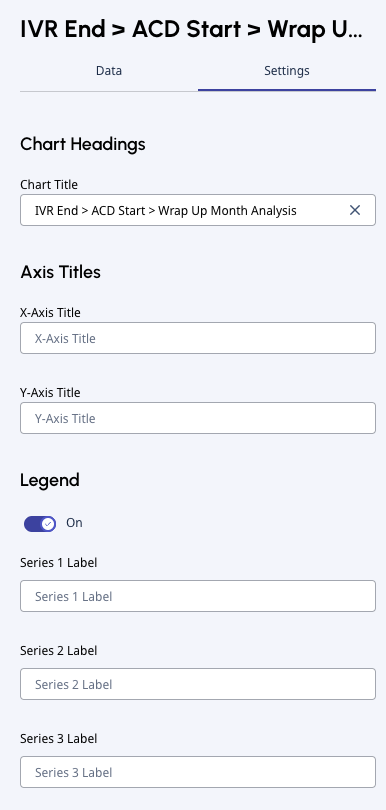
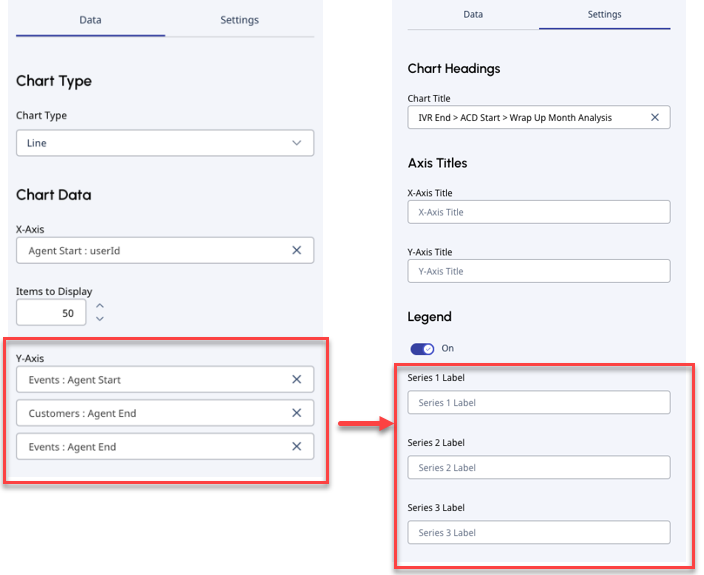
      Set the chart headings and label names in Settings.

      1. Enter a name for the chart in the Chart title.
      2. Enter the axis titles in X-axis title and Y-axis title.
      3. Toggle Legend on or off.
      4. If you define Y-axis data points under the Data tab, you can update their labels in Settings. Set the label names for the Series labels. You have the same number of Series labels as many Y-axis data points that you define under the Data tab.

      Data tab

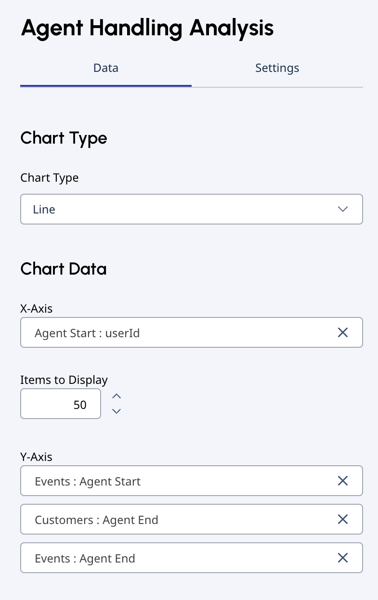
      You can set the chart type and define chart data.

      Chart type

      You can select from three chart types: Column, Bar, Line.

      注释:
      • Genesys Cloud recommends that you use bar charts for categorical data, such as labels.
      • If you have more than two variables and more than 30 values, Genesys Cloud recommends that you use a line chart.

      Chart data

      Journey Management charts enable you to count event data by time and attribute values. You can show customers or events. Customers are the unique customers that fit the chart criteria. Events are the total number of interactions that fit the chart criteria.

      • Time series include: day, week, month, or year.
      • Attribute values include: default and organization-defined values.
        Examples for default values: direction, message types, disconnect reasons, transfer type.
        Examples for organization-defined values: QueueID, flowID, userID (agents), intents, botID, wrapupCode.
      1. Set the X-axis data points under the Data tab.  
        • Default values for Time:
          Time value Default value
          Last 28 days of data
          Last 12 weeks of data
          Last 13 months of data
          Year Calendar year and previous calendar year of data

          Note: You can select up to 50 items to display, so you can increase any of the time values to 50.
        • Default values for Attribute: Genesys Cloud lists the top 50 labels. 
          注意:
          • If you create a chart on event:attribute selection on the X-axis of an event, you can only set up the chart on that specific event, or on events that come after that specific event in the journey path. It is not possible to create a chart on events that have preceded that specific event, or are not on its path.

          • Not all attribute values have data. For more information, see Filters in charts.

      2. Set the Y-axis data points: you can choose Customers or Events as the data type. Select the data type from the drop-down, then select the corresponding event.
        • If you define Y-axis data points, you can go back to Settings and update their labels. Select the label names for the Series labels. You have the same number of Series labels as many Y-axis data points that you have defined.
      3. Click Create chart. Genesys Cloud takes you back to the journey canvas.

      You can choose to create another chart or run a calculation.

      Calculate charts

      1. Open the journey that you want to perform calculations for.
      2. Click Calculate in the upper right corner.
      3. Genesys Cloud runs a new calculation on the journey and all the associated charts.
        注意: 计算可能需要一些时间才能完成。

      Understand chart results

      To open a chart, click the Charts icon in the upper right corner of the journey canvas.

      Click a chart to see a detailed visualization.

      Post chart calculations

      Note: You do not need to run a new calculation if you change the chart type. Genesys Cloud recommends chart type change to line chart if it is difficult to read a bar or column chart with more than 2 variables and 50 values.
      • If your journey is in Analyzer mode, click View Chart Details to see the chart configuration. You can’t edit your chart in this state.
      • If your journey is in Edit mode, click Edit chart to open the chart editor.

      示例

      Example chart

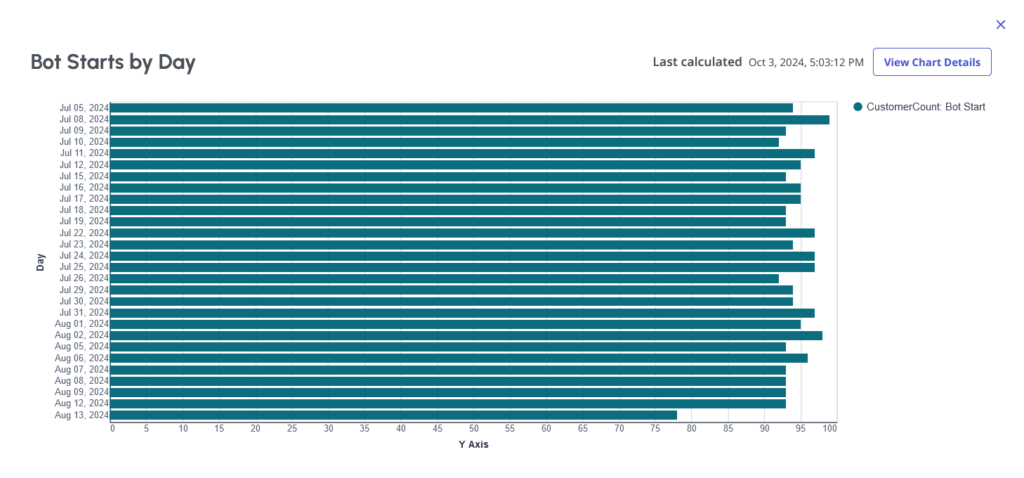
      This example chart shows a bar chart.

      • The Title is set to Bot Starts by Day.
      • The Y-axis is set to Day time value, and the X-axis is set to the Customers: Bot Start event under the Data tab.
      • Because no label is set for the Y-axis data point in the Settings tab, no label title appears.

      Example chart

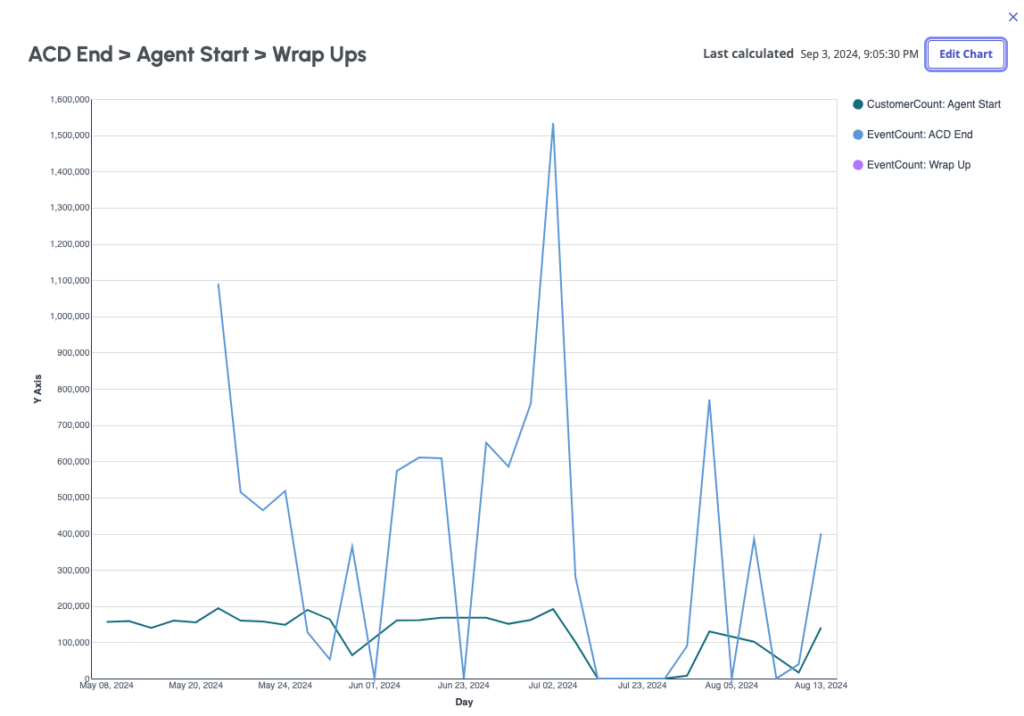
      This example chart shows a line chart.

      • The Title is set to ACD End > Agent Start > Wrap Ups.
      • The X-axis is set to Day time value. The Y-axis has three data points: CustomerCount: Agent Start, EventCount: ACD End, EventCount: Wrap up.
      • For Y-axis data points, numeric labels are set in the Settings tab.

      Chart result errors

      Charts can display the following errors:

      • Invalid chart: An event was deleted from the journey.
      • Requires calculation: You have not yet run a calculation on the journey. Calculate the journey so the chart can update.
      • Update calculation: The previous calculation is not valid, because the journey was edited. To update the chart, run a calculation.
      • No data: No data exists to support the ability to create the specified chart. Possible reasons are that the selected attribute has no data due to a filter, or the nature of the event itself.