
代理时间线详细信息视图
以下权限:
- 用户界面>主管代理人详情>看法
- 目录>用户>看法
- 分析>用户详情>看法
要查看时间线的交互部分:
- 分析>对话聚合>看法
- 分析>对话详情>看法
要选择指标,需要以下之一:
- 分析>用户聚合>看法
- 分析>对话聚合>看法
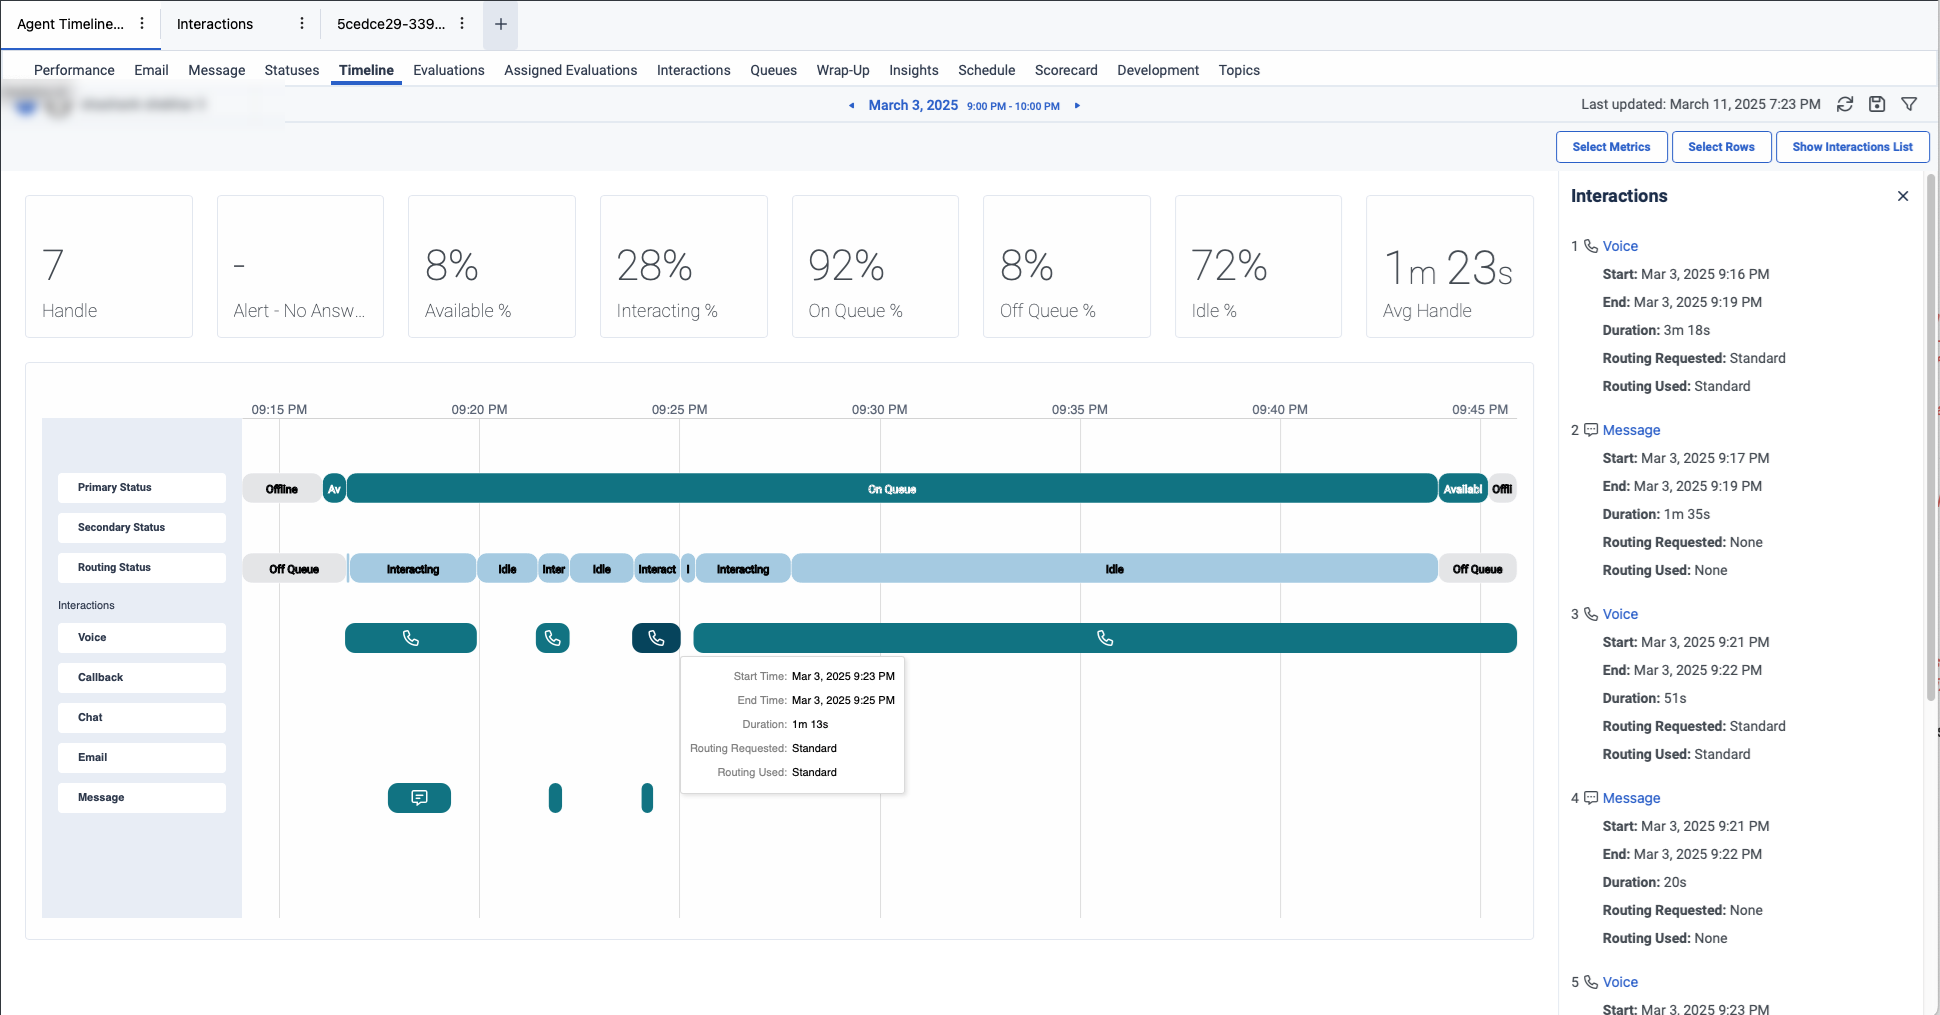
代理时间线详细信息视图提供了代理处理的对话的详细视觉表示。通过此视图,主管可以更好地了解代理的活动。主管可以看到代理处理的语音对话序列如何与多个同时进行的数字交互的重叠交织在一起。
默认情况下,此视图提供有关主要状态、次要状态、路由状态以及语音、回拨、聊天、电子邮件和消息等各种交互的详细信息。
要查看代理时间线详细信息:
- 点击表现>工作区>联络中心>代理绩效。
- 点击菜单 > 分析>分析工作区。
- 在默认部分,搜索代理绩效然后单击视图名称将其打开。
- 从代理绩效摘要视图中,单击代理名称。显示代理的绩效详细信息视图。
- 点击时间线选项卡。出现代理时间线详细信息视图。
 要查看最新数据,请点击刷新。
到保存视图, 点击保存视图。
您可以放大或缩小时间轴中的时间范围。例如,您可以看到日期选择器中选择了 3 月 3 日晚上 9 点至 10 点的时间间隔。但是,时间线被放大到晚上 9:15 之前和 9:45 之后。如果缩小,您可以看到从晚上 9 点到 10 点的整个小时。如果放大到少于一小时,则可以水平滚动到左侧的晚上 9:00 边界和右侧的晚上 10:00 边界。
要在 Windows 操作系统中放大和缩小,您可以按住 Control (Ctrl) 键并使用鼠标或触控板滚动。要在 Windows 操作系统中水平滚动,您可以使用触控板。要在 Mac OS 系统中放大和缩小,您可以按住 Command (CMD) 键并使用鼠标或触控板滚动。要在 Mac OS 系统中水平滚动,您可以按住 Shift 键并使用鼠标或触控板滚动。
- 如果代理长时间不活动,时间线不会显示主要状态、次要状态或路由状态的任何结果。
- 您只能查看最多七天的数据。
- 如果选定时间范围内的交互次数超过 200 次,则会在顶部显示一条警告消息,并提供指向代理交互详细信息视图页面的链接。
自定义视图
要仅显示特定数据,请自定义代理时间线详细信息视图。例如,您可以选择仅查看某些指标或过滤以查看某些类型的交互。
要自定义分析视图,请使用日期过滤器。

要按日期过滤指标或配置自定义日期范围,请使用预设。筛选此视图的指标时,选择最多 7 天的任意自定义日期范围。
要使用预设筛选量度,请完成以下步骤:
- 要显示日期筛选器,请单击日期。
- 在 “预设” 列表中,选择一个预设日期选项。
日期预设
| 预设 | 描述 |
|---|---|
| 当前时间间隔 | 显示当前 30 分钟时间段的数据。 |
| 今天 | 显示包含当前间隔的时间段内的数据。 |
| 昨天 | 显示前一天的数据。 |
| 本周 | 显示周日至周六时间段的数据。 |
| 上周 | 显示前一周(周日至周六)的数据。 |
| 前 7 天 | 显示过去七天的数据。 |
| 间隔 | 显示 30 分钟时间段内的数据。 |
| 日 | 显示一天 24 小时的数据。 |
| 周 | 显示周日至周六时间段的数据。 |
- 要使用自定义日期范围筛选指标,请完成以下步骤:
-
- 单击日期以显示日期筛选器。
- 在日历上选择开始日期和结束日期,然后单击筛选箭头。
- 要使用相同的日期预设查看不同时间段的数据,请单击日期显示两侧的箭头。例如,要查看前一天的数据,请点击天预设,然后单击日期左侧的箭头。
- 要使用相同的日期预设查看不同时区的数据,请从时区下拉菜单中,选择所需的时区。 您可以使用相同的选定时区创建和保存报告。
按媒体类型过滤互动:
- 单击过滤器图标
 。
。 - 选择媒体类型。
根据所选的媒体类型对交互进行过滤。
要选择摘要行的指标:
- 点击选择指标。
- 选择所需的指标类别,例如基于计数,基于百分比, 和基于时间。
- 选择所需的指标。有关可用指标的更多信息,请参阅代理时间线详细信息视图按类别查看性能视图中的可用列一文中的部分。
笔记:您最多可以选择 12 个指标。 - 点击添加。显示选定的指标。
要查看性能视图中可用指标的综合列表,请参阅性能视图中可用列的合并视图。
要显示或隐藏时间线行:
- 点击选择行。这选择行出现弹出窗口。
- 选择所需的行,例如主要状态,次要状态,路由状态, 和互动。
- 点击确认。选定的行显示在左侧。
要显示或隐藏交互列表,请点击显示交互列表。
所选日期范围内的所有交互都列在右侧。
要查看有关任何交互的更多详细信息,请单击所需的交互。您将被引导至交互详细信息查看页面。